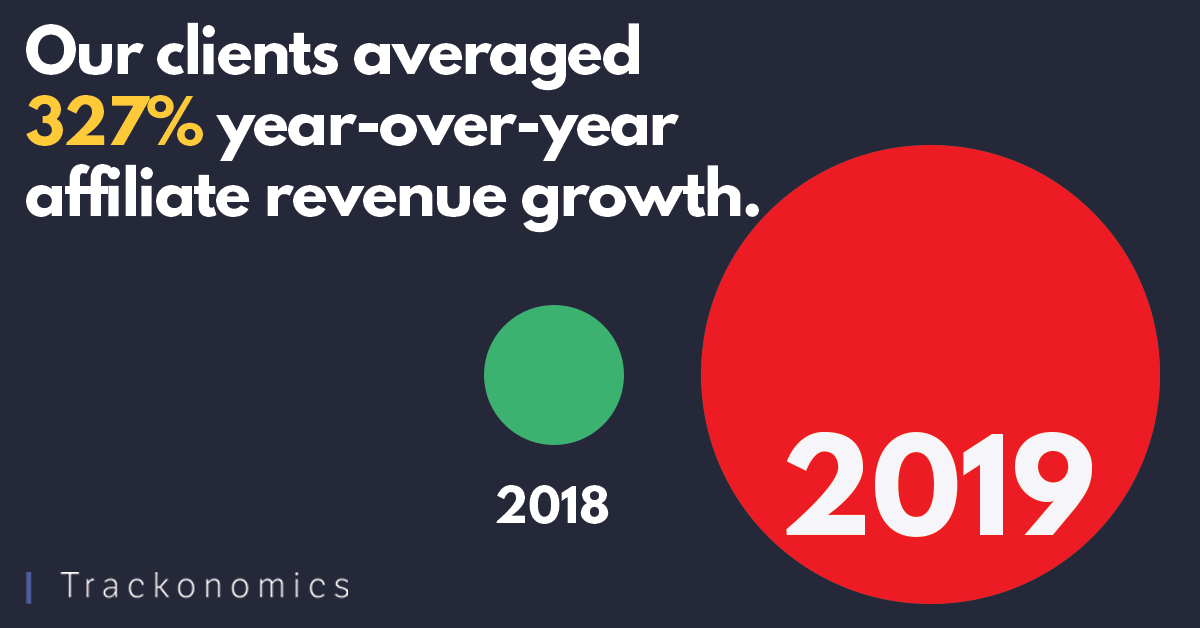
In the few years since large scale digital publishers entered the affiliate arena, they have advanced the use data to drive growth dramatically... We’re talking on average, 327% year-over-year growth.
Just last year, it was enough just to get multiple affiliate networks on one dashboard. That’s no longer the case. Publisher challenges have changed, and we at Trackonomics have made great strides to adapt our products to help them succeed.
How have we been doing this?
Doubled our server capacity.
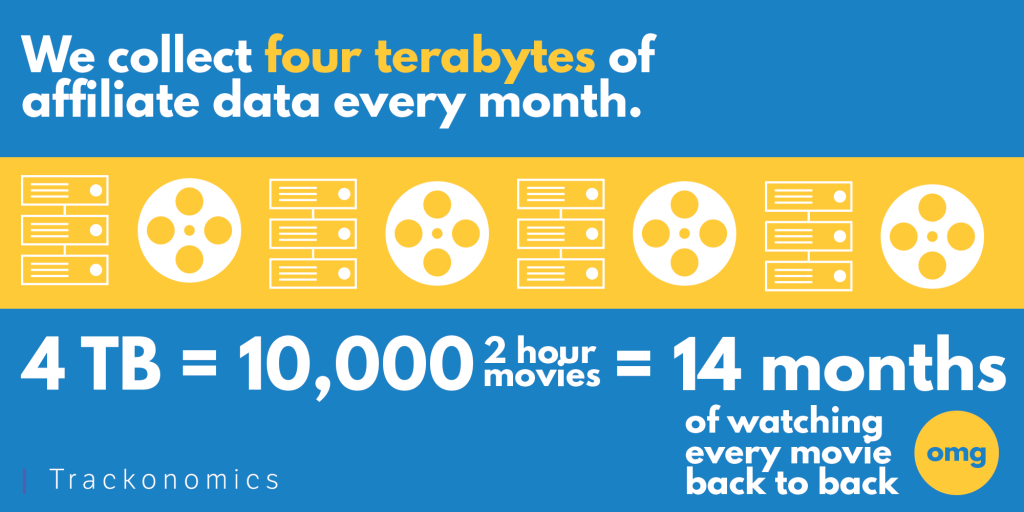
The amount of granularity publishers need has grown tremendously. As have their affiliate efforts. Publishers are producing a lot more content. More links means more activity, which means more data. And more data. In order to keep up with the amount of information coming in, we’ve beefed up our servers which are at the moment collecting over four terabytes a month. That’s almost half as much data as what the Hubble Space Telescope collects in a year. Or to put it in more relatable terms, four terabytes can store 10,000 two-hour movies. If you played those movies back-to-back? It would take 14 months to watch.

In other words, we can store a sh*t-ton of data (pardon our French).
Launched a new dashboard.
Say what? Yeah, we went there. The old dashboard got most of what publishers needed, but since things change so quickly, we came up with a more flexible solution. With this new dashboard, every client can generate bespoke reporting, which includes data visualizations built in seconds with a selection of more than 50 data parameters. Improved functionality includes, shareable widgets for better team collaboration, contextual data layering for deeper insights making affiliates not just valuable for their commissions, but also for the information they collect.
We can now show data at the article level.

The need for article level affiliate data was quite possibly the biggest development we saw with our clients. The value each article can generate has become the metric in measuring the success and determining how to shape future content. We noticed that almost everyone was trying to figure out how to get data at the article level. Fortunately, we had technology that just needed a tweak to focus specifically on the articles.
Now, at the page level users can merge affiliate with non-affiliate data. With this enhanced centralization of data sources, clients get the context they need to analyze performance against:
- Traffic (Adobe / Google Analytics)
- SEO keywords (SEMRush)
- Search volume (SEMRush)
- Referral sources (Funnel Relay)
- Campaigns (Funnel Relay)
- Partnership data (Funnel Relay)
Given the new dashboard can display the above data in a multitude of ways, publishers can push for even greater advances and tremendous affiliate growth in Q4 as well as for 2020.

While there is still more to come, we’re slowing down actual development for Q4 to focus on helping clients through their busiest and most lucrative time of year… the holidays. We’re excited to see the results of the evolutions both from the publishers and from the tools we’ve made to help them.
Get in touch to learn more about how Trackonomics can help you grow your affiliates.