Curious about what you can do with the performance widget? Here are three key features:
- Time frame display
- Download data in Excel
- Annotations
Time Frame Display
1. The first feature is time frame display. At the top of the performance widget is an option to view data for a day, week, month or year.
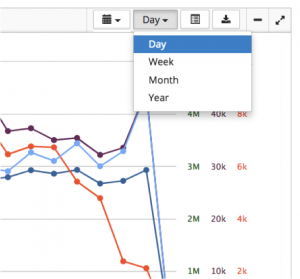
In addition, you can view this information as either a graph or a table at the top of the performance widget.
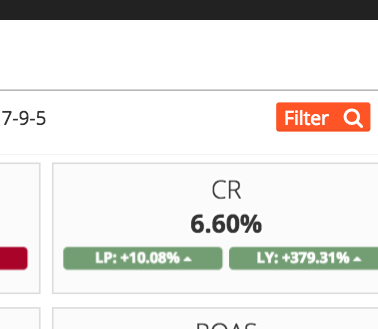
Also, if you want to customize the time frame, click on Filter and in the Filters Manager change the Date Range.
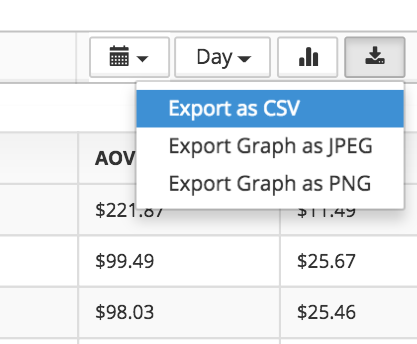
Exporting Data to Excel
2. The second feature of the performance widget is data exporting. You can export all of the data in the performance widget into an Excel file, either grouped by day, week, month or year.
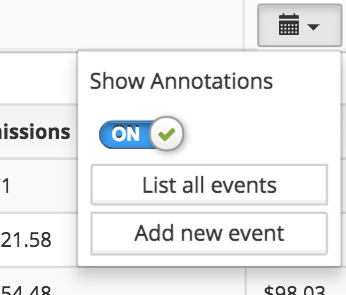
Annotations
3. A final feature of the performance widget is annotations. You can annotate your KPIs and events by clicking the calendar icon and turning the annotations on (annotations are turned off by default). Once you turn on annotations, you can see different events (i.e. tests, promotions) in the time frame you selected.